Every dollar tracked. Every score live. You know before your users do.
Real-time scoring in production. Cost by surface — agent, eval, trainer, cert. Drift detection that catches degradation the moment it starts.
You know the moment something breaks.
Every production run scores against your eval chain in real time. Latency, refusals, cost, quality — all visible from a single panel. When a threshold breaks, the alert fires immediately.
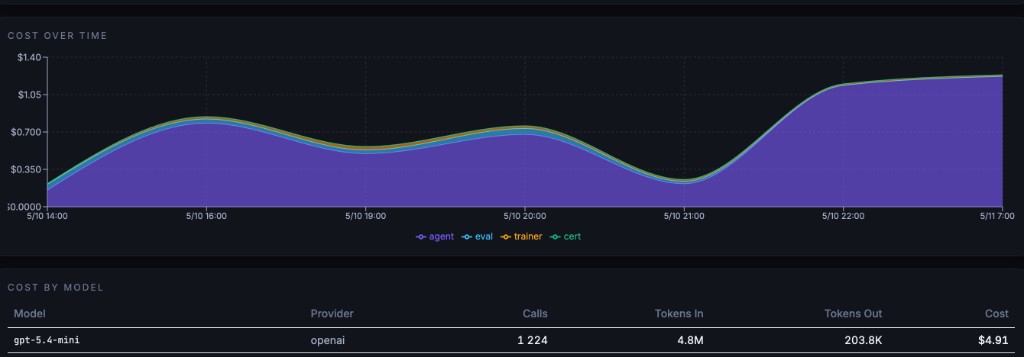
See where your budget goes.
Stacked cost breakdown by surface. See exactly where your budget goes — token events, API calls, evaluator runs, certification overhead. Set cost guard thresholds and get alerts before budgets overrun.
Degradation caught. Retraining triggered. No manual step.
When context adherence drops from 0.78 to 0.61, you don't find out from a user complaint. The alert fires, the drift is logged, and retraining can trigger automatically — closing the loop from detection to improvement.
- ·Context adherence, completeness, PII leak, latency SLA, token budget
- ·Drift alerts — score 0.78 → 0.61 flagged instantly
- ·Auto-retrain when thresholds breach — no manual intervention
Performance, quality, and safety — all in one view.
No separate dashboards. No manual data pulls. Every metric scored continuously against your thresholds.
Latency distributions (p50, p95, p99), token usage per run, API cost per call, throughput per minute. Thresholds configurable per agent. Alert fires when p95 latency exceeds your SLA for 3 consecutive runs.
Evaluation scores from your Forge eval chain run on every production request. Drift detection compares rolling 100-run averages against baseline. When quality drops — hallucination rate spikes, accuracy falls — you see it within minutes, not days.
Three detection layers: (1) Rule-based pattern matching catches known injection patterns and PII formats in real-time. (2) Boundary enforcement blocks tool calls the agent isn't authorized to make. (3) Adversarial probing runs on a sample of production traffic to test resistance. On violation: block the response, fire alert, log the full trace for review.
Ready to monitor your agents in production?
Real-time scoring, drift alerts, and cost tracking.