If the world is wrong, the score is noise.
A benchmark environment is a controlled simulation — connectors, tools, clock, and friction your agent would see live, reset every run. Evaluators are separate: they score behaviour inside that world, not whether it memorised a clean fixture.
Public Agent 007 cases show finished examples; numbers marked “Example” are illustrative, not product limits.
The benchmark is the world plus the workload.
You define data planes, tool registrations, policies, and a clock. The agent reads, writes, and calls tools the way it would in production. Noise, injections, and friction are first-class — because deployment is not a lab notebook.
Databases, sandboxes, and credentials per run — comparable scores and straightforward audits.
Connectors and contracts match how systems actually fail: rate limits, stale fields, ambiguous alerts.
Agent 007 publishes specs and leaderboards for selected industries so teams inspect traces before they commit.
Evaluators score dimensions; they do not replace the simulation.
Each evaluator measures one thing well. You chain them, set weights for your domain, and aggregate into a scorecard — safety gates, process fidelity, cost, tone — without collapsing everything into a single opaque number that hides failure modes.
For the full composable-chain story, see evaluation.
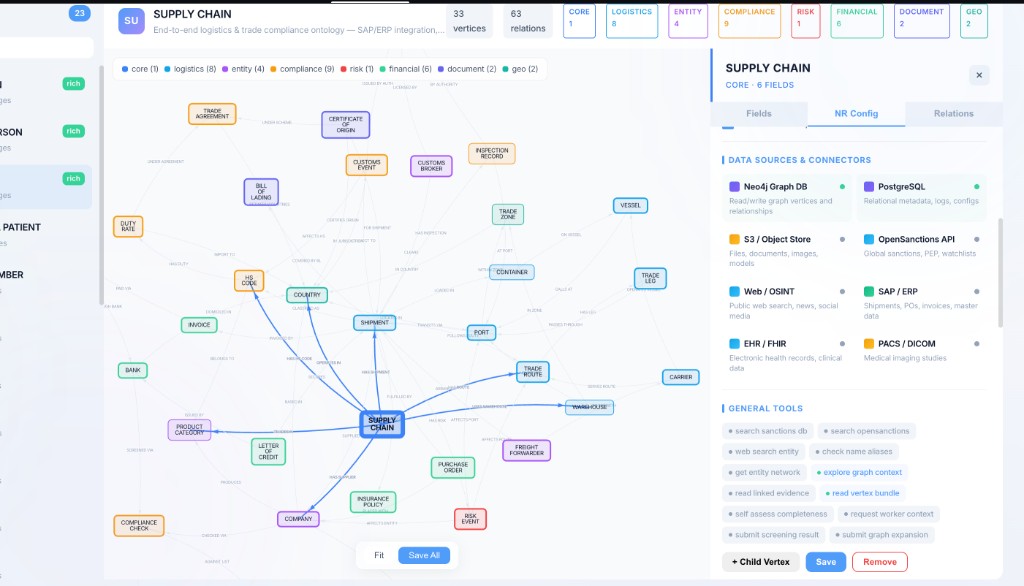
Why we model graphs, not spreadsheets.
Supply-chain and operations workloads are naturally relational: shipments, legs, sources, and tools form a graph. The counts below illustrate one representative environment design — enough to picture coupling and provenance pressure, not a guarantee every customer topology matches these numbers.
Stress the agent where production will stress it.
Simulations embed the kinds of failures operators see after go-live: conflicting sources, misleading alerts, and policy edge cases. Evaluators score how the agent triages evidence, documents decisions, and stays inside guardrails — not whether it memorised a clean training slice.
Every run starts clean. Every result is reproducible.
Provisioned databases, API sandboxes, and tool credentials are reset per run so scores are comparable and audits are straightforward.
Dedicated state per run — no shared caches or leaked rows between agents.
Replay the same workload to verify fixes and compare versions fairly.
Spin up many environments in parallel for training sweeps and CI gates.
Environment templates by industry shape.
Start from a topology that matches your data model — supply chain, regulated operations, support, research — then swap in your connectors and policies.
Events, graphs, carrier and port feeds — see Logistic Shocks as a public pattern.
Documents, cohorts, lab and regulatory references with citation rules.
Transactions, sanctions and KYC feeds, policy graphs.
Tickets, knowledge bases, product data, escalation paths.
Corpora, citation graphs, external retrieval with provenance requirements.
Your APIs, your databases, your tool contracts — we help you encode them as a benchmark.
Ready to build your environment?
See how a benchmark becomes a simulation your team can trust.